Climate Culture Boston Index 2023
Internal Summary of Results
24 October, 2023
Core Results
Highlights
- On consideration, two potential behavioral categories emerge: a group comprised of retrofitting homes, reducing beef consumption, installing solar panels, and purchasing electric vehicles, considered by 40%-47% of Boston residents. The second group involves heat pump installation, carbon offset purchase, and community solar subscription, considered by only 6%-14% of the population
- Despite moderate levels of consideration, the majority does not anticipate adopting these behaviors in the near future. The intention and adoption rates are particularly low for purchasing carbon offsets and subscribing to community solar, possibly due to lack of familiarity with the behaviors.
- Perception among Boston residents suggests low adoption rates of these behaviors within their community. The exception being home retrofitting, which scored the highest on empirical expectations indicator, likely due to the recognized benefits of insulation and energy efficiency upgrades.
- Among all behaviors, those relating to renewable energy and efficiency (home retrofitting, rooftop and community solar subscriptions) have the highest proportion of residents believing that people should adopt them.
- Relative to other behaviors, average confidence levels are low for purchasing offsets or subscribing to community solar.
- A majority of people recognize the benefits of improved insulation or the use of energy-efficient appliances, potentially suggesting that benefit-oriented messaging may resonate with interested individuals.
- Although the benefits of home retrofitting are likely well understood, individuals also recognize the inherent complexity and challenges associated with this process.
Methods
In May 2023, we recruited 1,015 adults, quota sampled to match the population of the Greater Boston area in age group x sex x ethnicity.
The sample was additionally weighted using survey weights to be representative of the Greater Boston area adult population in age group x sex x ethnicity and Hispanic/non-Hispanic origin.
Results from 2021 are available here.
Index Trends
Changes from 2021
Highlights
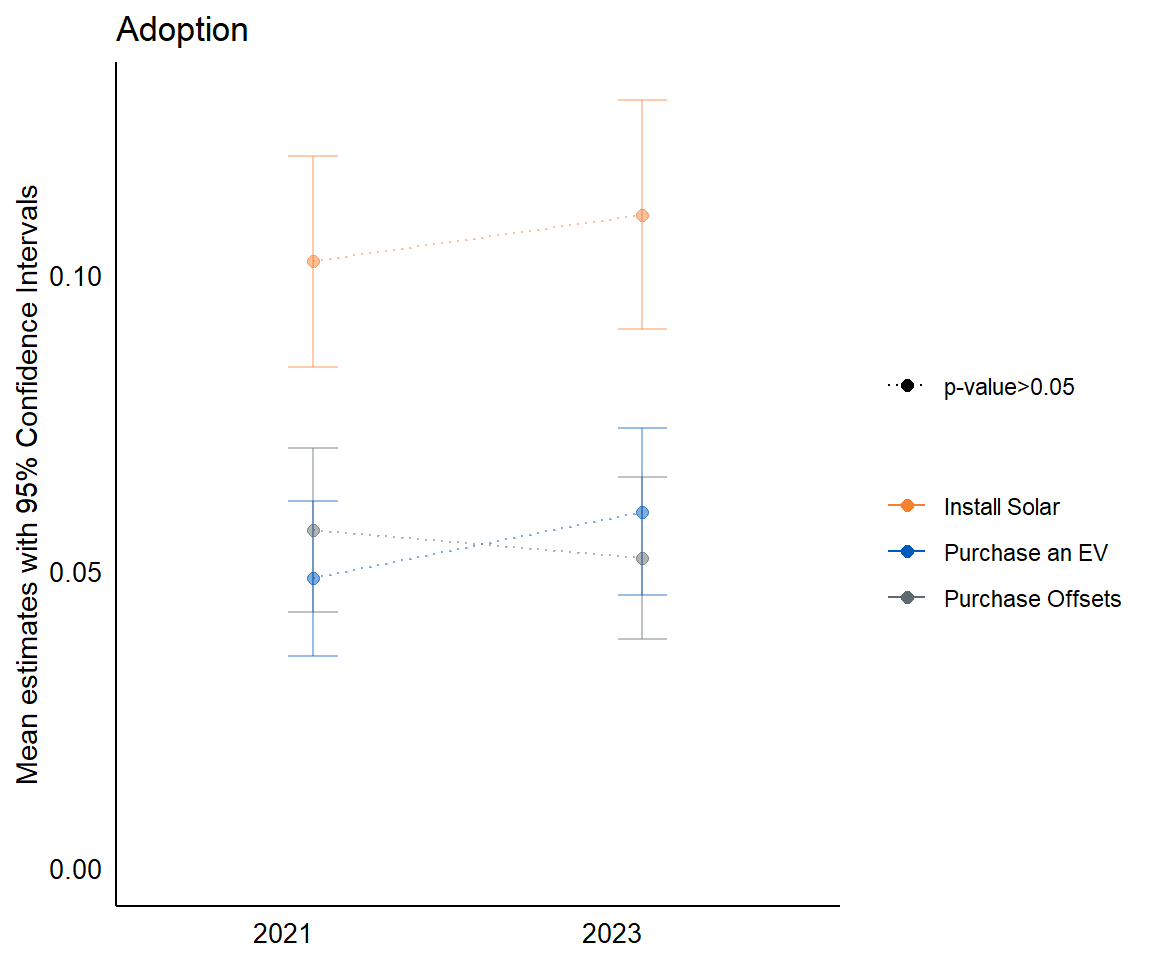
- There has been no statistically significant change in the reported adoption for the three featured behaviors across two waves of the index
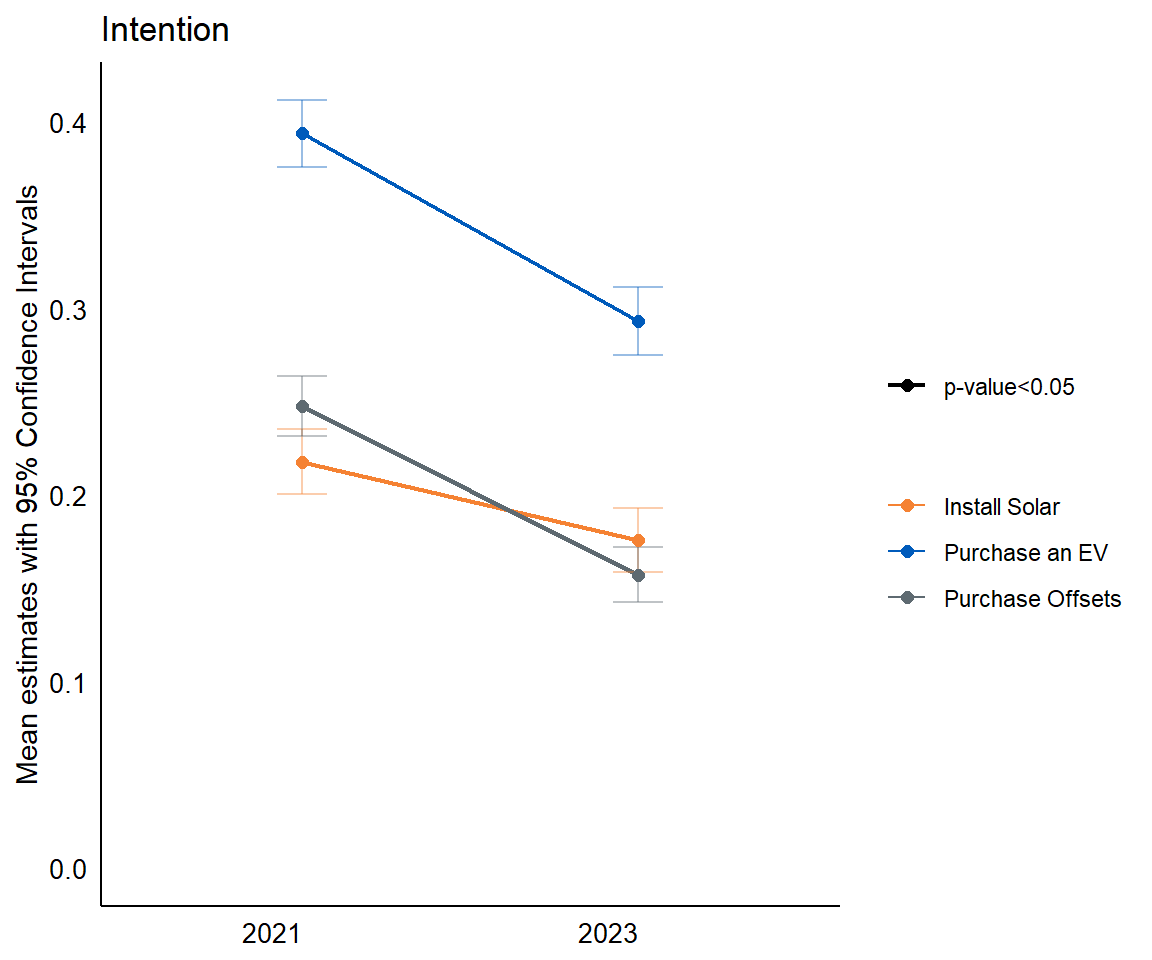
- The average intention to adopt the three behaviors decreased since
2021:
- The decrease in the intention to purchase an electric vehicle (EV) and purchase carbon offsets could be due to the alterations in how these behaviors were described in different waves of the study (refer to the ‘Caveats’ section on the ‘National’ tab for more details)
- The average intention to adopt these three behaviors in Boston is on par with estimates in Denver and the US in general
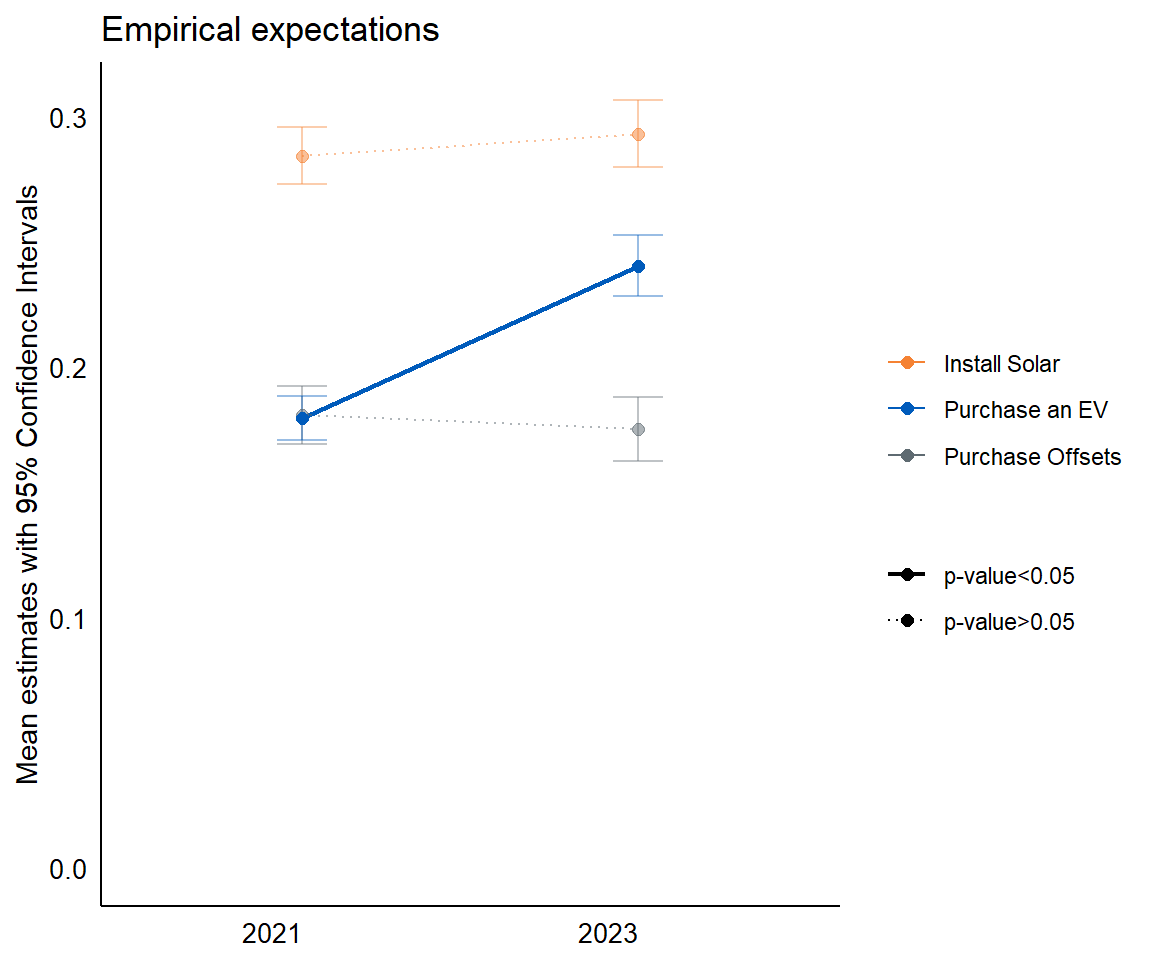
- Most people in Boston area think that few people in their surroundings are either driving an electric vehicle, purchasing offsets, or installing solar panels. Although there has been a slight increase in the empirical expectations around EVs since 2021, this difference is small and practically insignificant
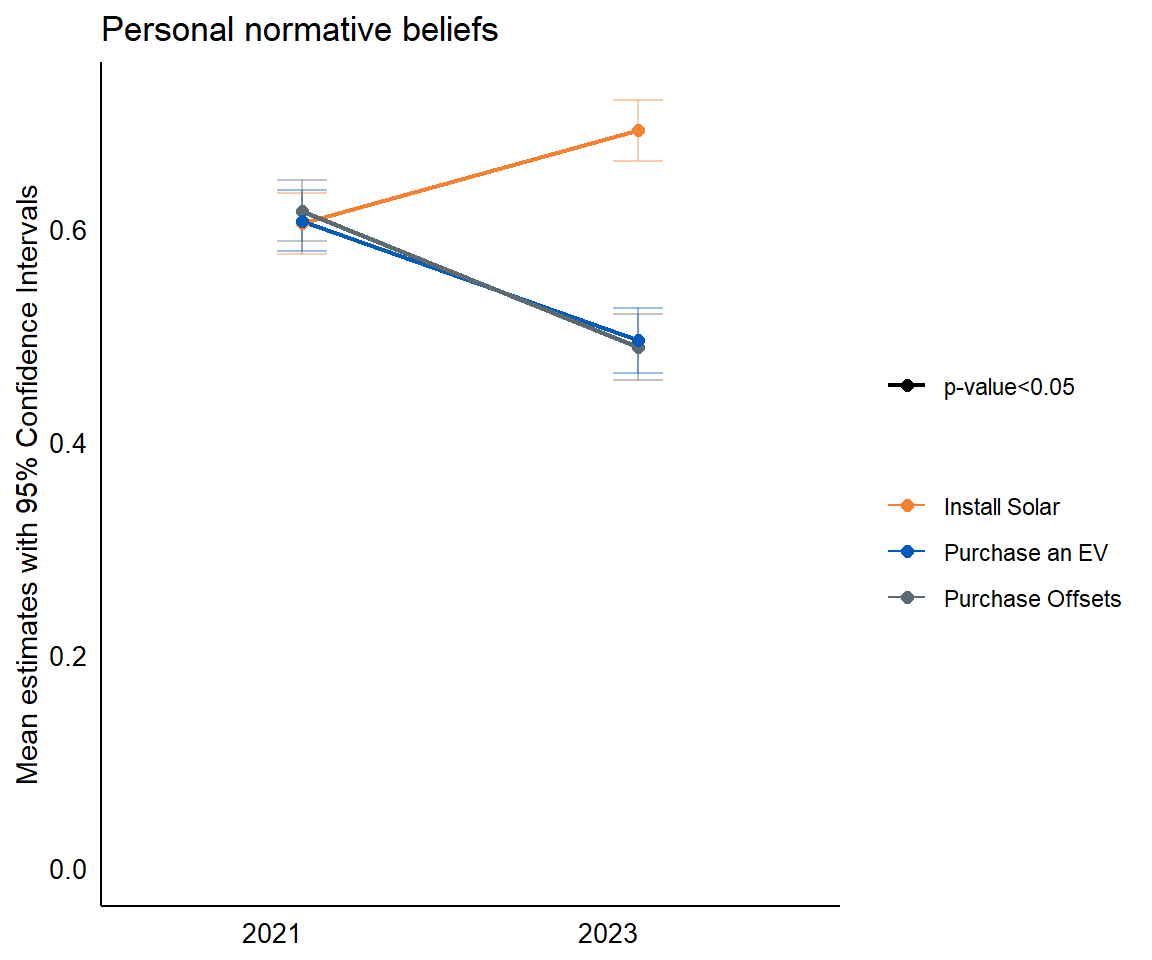
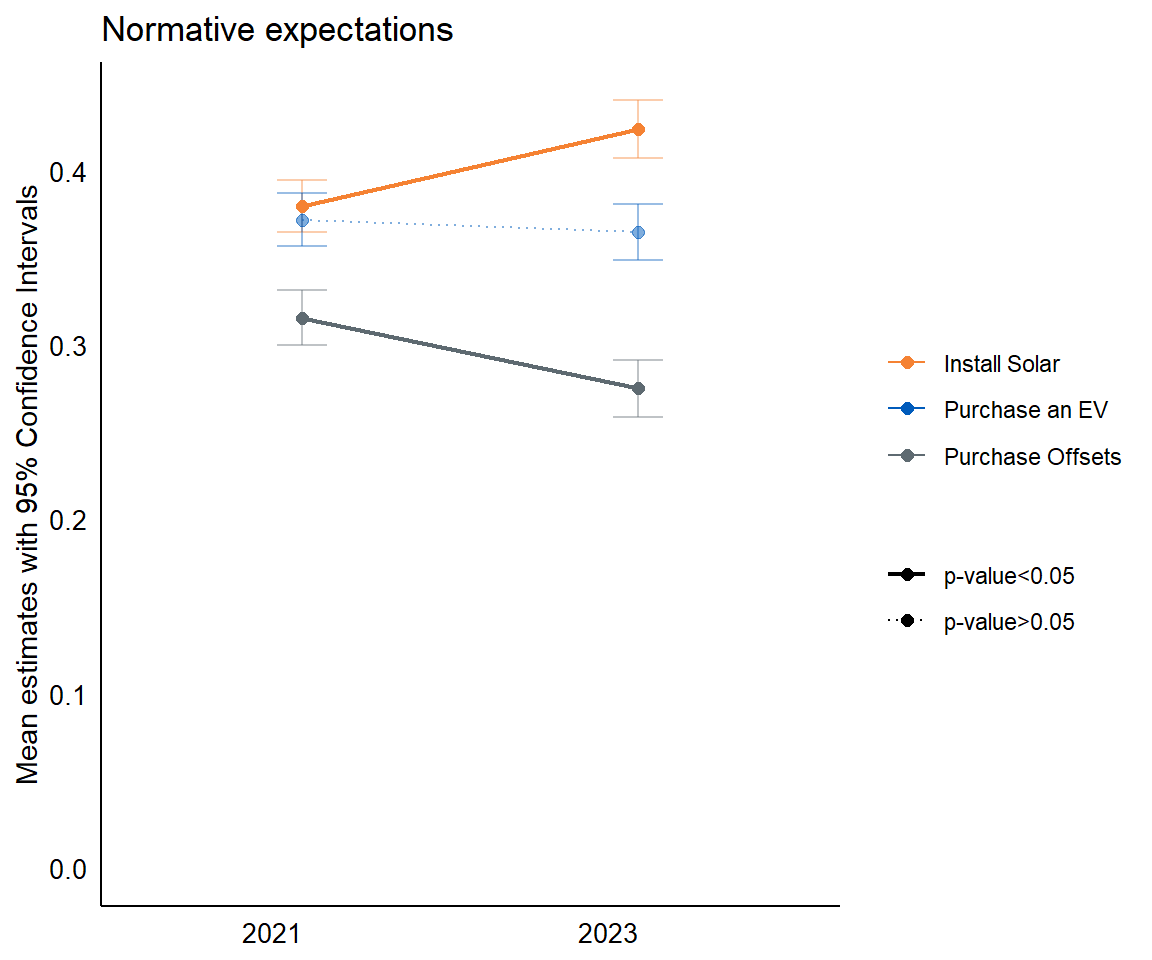
- The share of the population that believes that people should be installing solar panels increased since 2021. However, normative beliefs surrounding EVs and offsets declined
- Similar to normative beliefs, we see a drop in the normative expectations (beliefs about how many people think one should adopt the behaviors) for EVs (statistically insignificant) and carbon offsets. Normative expectations around solar has increased. Across the board, the changes in these three behaviors are minimal and likely have little practical significance.
The Normative Gap
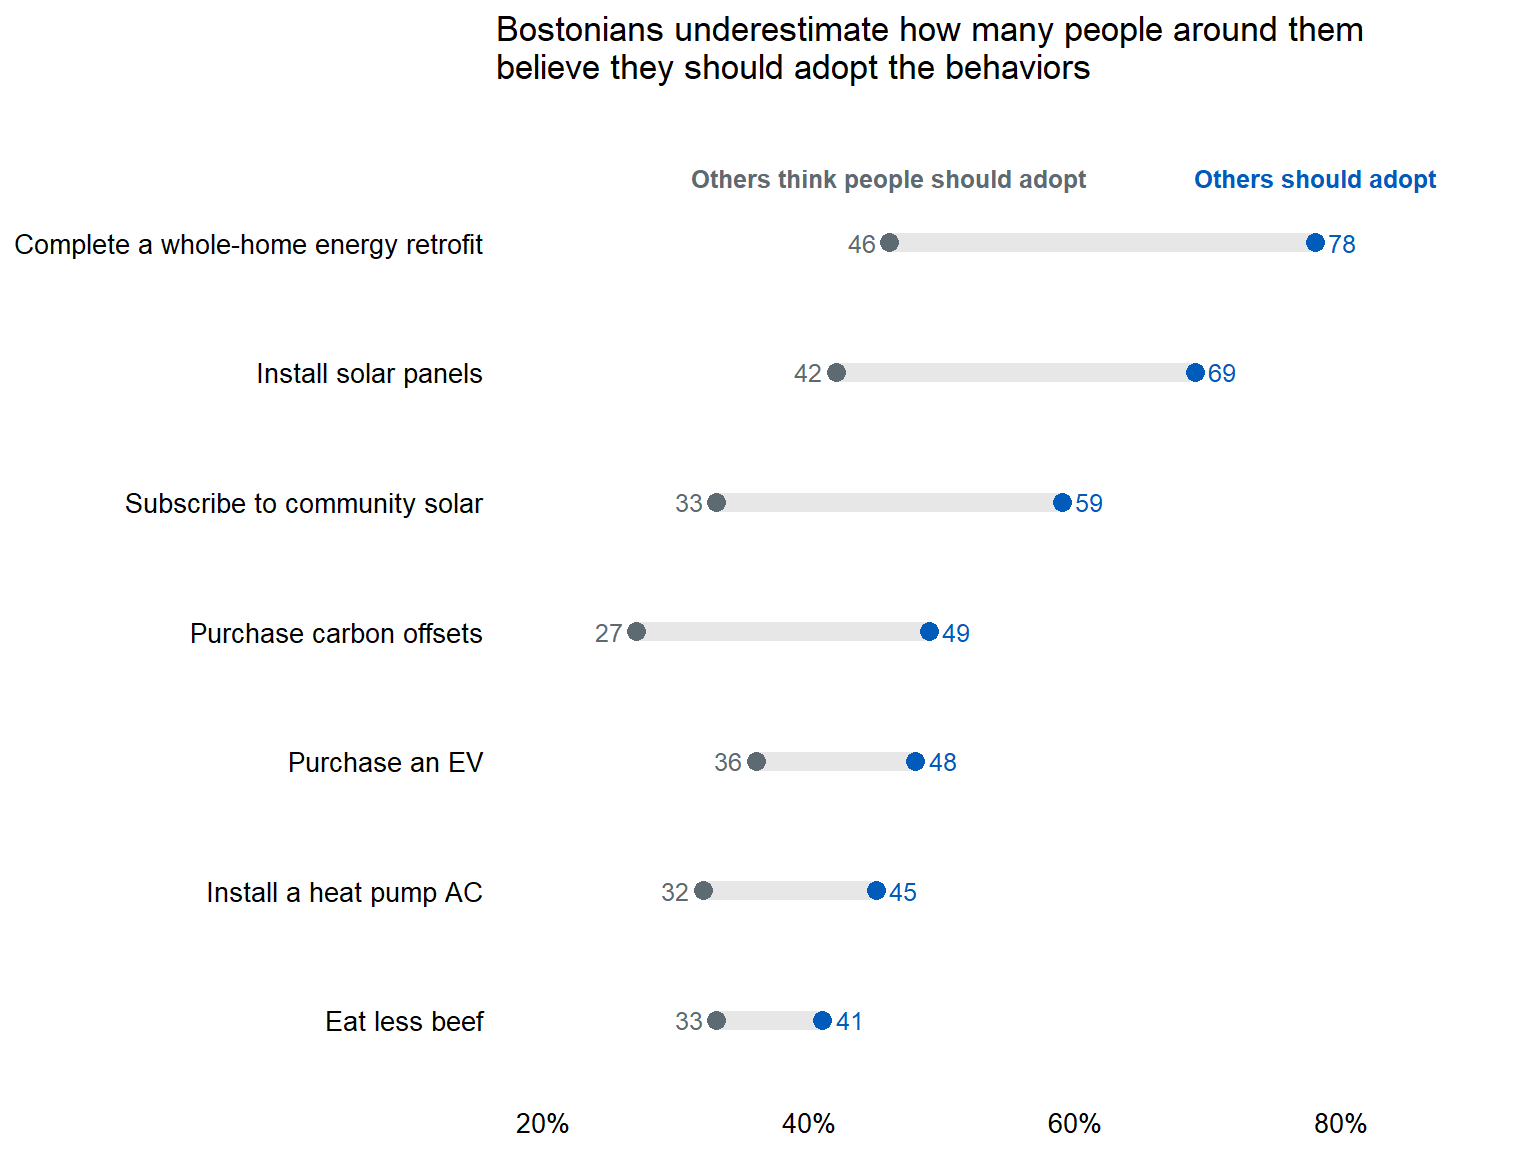
Across all behaviors surveyed, there is a gap between what people believe (Beliefs that others should adopt because it is the right thing to do; personal normative beliefs) and what they think other people believe (Beliefs that others think people should adopt because it is the right thing to do; normative expectations). That is, residents of the Boston area underestimate how many other people around them believe that one should adopt the behaviors.
Appendix
Distribution of political orientation in the sample
Question: In political matters, people talk of “the left” (1) and “the right” (10). How would you place your views on this scale, generally speaking?
##    Value Perecent
## 1      1     9.17
## 2      2     8.48
## 3      3    10.85
## 4      4     8.78
## 5      5    32.05
## 6      6     9.96
## 7      7     6.90
## 8      8     5.03
## 9      9     3.45
## 10    10     5.33
## Min. 1st Qu. Median Mean 3rd Qu. Max.
## 1.000 3.000 5.000 4.867 6.000 10.000Distribution of global warming questions
Question: How important is the issue of global warming to you personally?
##
##  Extremely important       Very important   Somewhat important
##                 27.0                 31.5                 26.5
##    Not too important Not at all important
##                  8.3                  6.7
Question: How worried are you about global warming?
##
##       Very worried   Somewhat worried   Not very worried Not at all worried
##               37.4               41.0               14.0                7.6
Question: How much do you think global warming will harm you personally?
##
##      A great deal A moderate amount     Only a little        Not at all
##              21.0              40.8              20.8              12.0
##        Don’t know
##               5.3
Question: How much do you think global warming will harm future generations of people?
##
##      A great deal A moderate amount     Only a little        Not at all
##              61.1              20.4               9.0               5.3
##        Don’t know
##               4.1